


Enrol in AgriStability before April 30
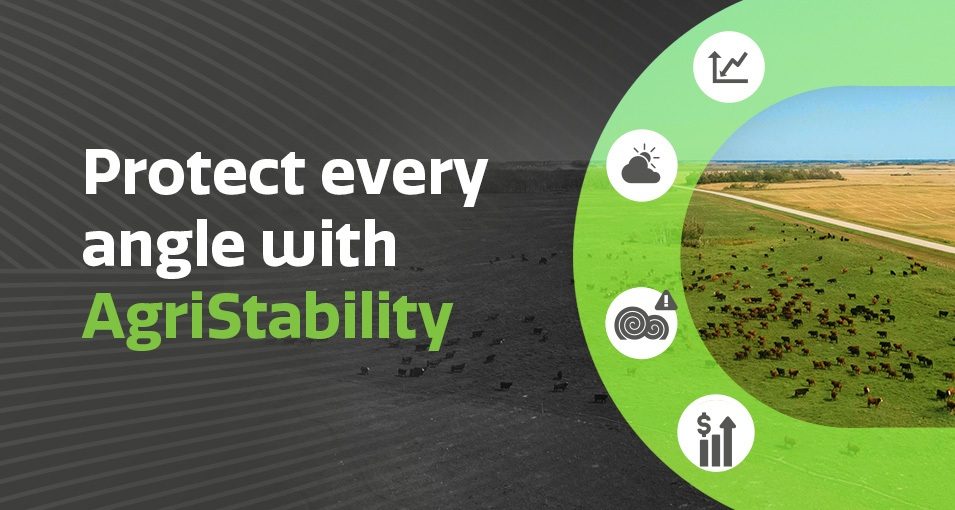
AgriStability is a cost-effective business risk management program that can help protect your entire operation against unexpected circumstances like weather, production loss, increased input costs or market conditions. Plus, it’s personalized to your operation based on your farm history.
In Saskatchewan, the average cost to participate in the AgriStability Program is $0.69/acre or $1.19/head.
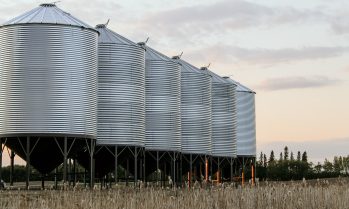
Coverage for Livestock Producers
With weather-based coverage for forage acres, price protection for livestock and personalized coverage options, SCIC offers a full suite of programs that can work together to ensure you have every angle covered!
As a producer, you know the risks you want to protect against. From Crop Insurance, to AgriStability, to Livestock Price Insurance, we’re here to help you find the right coverage for your farm!
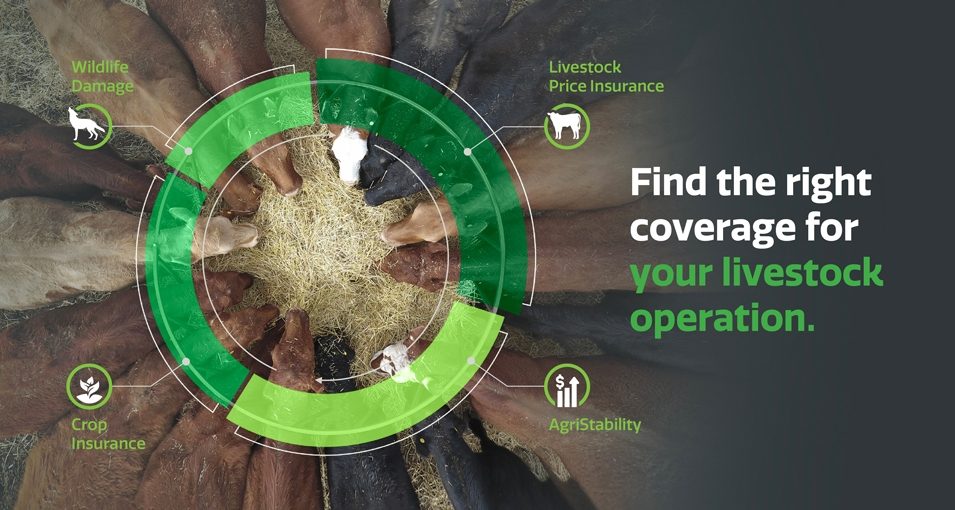
What does coverage look like for your farm?
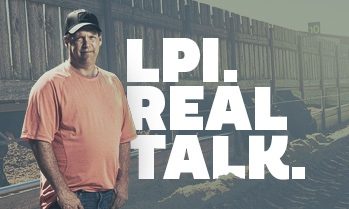
"It's not a get rich quick scheme, but it’s just live to fight another day!"
Saskatchewan producers discuss how SCIC's business risk management programs can work together to ensure you have all-around, 360-degree coverage.

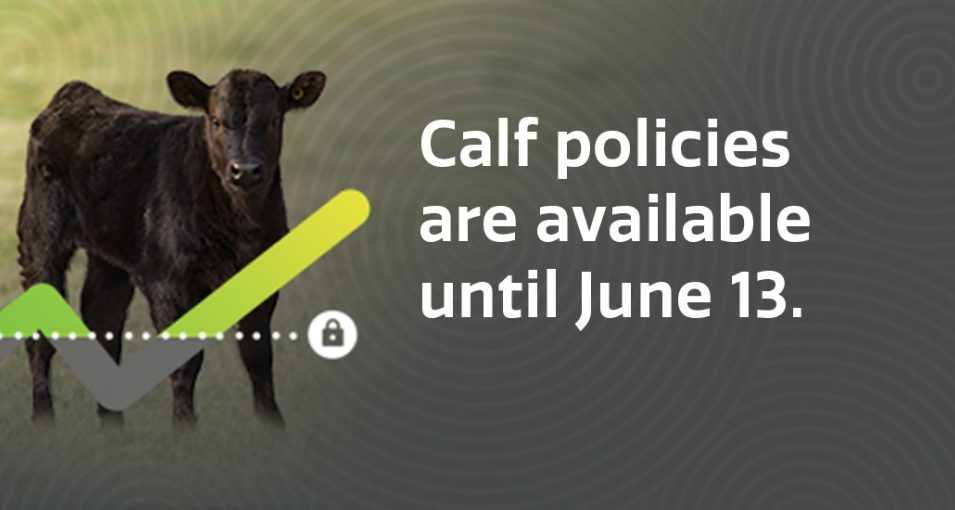
Livestock Price Insurance for Calves
Livestock Price Insurance (LPI) allows you to purchase price protection on calves in the form of an insurance policy. Enrol, register for weekly LPI emails, review and purchase. Calf policies can be purchased until June 13. Feeder and Fed policies are available year-round.
Covers crops from seeding to harvest. Optimize your coverage by selecting the right options to meet your needs.
Learn moreA cost-effective program designed to help farm operations facing large margin declines.
Price protection against an unexpected drop in the market prices on cattle and hogs.
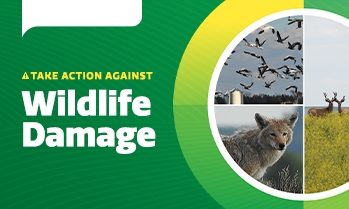
Learn moreCompensation for damage caused by wildlife available to all Saskatchewan producers. You do not need to be a SCIC customer to file a claim.
Learn moreLatest News from SCIC
-
AgriStabilityIs it time to participate in AgriStability?POSTED: Apr 15, 2024Full Article
-
News ReleaseTop up on the Way for Eligible Livestock Producers Through 2023 Canada-Saskatchewan Feed ProgramPOSTED: Apr 8, 2024Full Article
-
Crop InsuranceWeather-Based Programs Support Livestock ProducersPOSTED: Mar 19, 2024Full Article